Table of Contents
1 Introduction 1
1.1 Reference Players 4
1.2 Naughty List 4
2 My History 5
3 European Bridge Team Championship 2014 11
4 August/September 2015 13
5 42nd Bermuda Bowl, Chennai, India, 2015 19
6 Post Bermuda Bowl 21
7 Law of Large Numbers (LLN) 23
8 Bridge is a Game of Mistakes 27
9 Bridge Cheating Concepts 29
10 Science 35
11 Data Collection 37
12 Data Sources 39
12.1 ACBL Data 39
12.2 European Bridge League (EBL) Data 40
12.3 World Bridge Federation (WBF) Data 40
12.4 BBO and The Vugraph Project (TVP) Data 41
12.5 Errors with the Data 42
13 Magic Formula (MF)/Mistakes Function (MF) 45
14 Advanced Cheating Detection Functions (ACDFs) 51
15 Opening Lead Functions (OLFs) 53
16 Traditional Anatomy of an Investigation 55
17 New Anatomy of an Investigation 57
18 Buratti/Lanzarotti 59
18.1 Statistical Evidence 60
19 Elinescu/Wladow 63
19.1 Statistical Evidence 69
20 Fantoni/Nunes 71
20.1 Statistical Evidence 75
21 Fisher/Schwartz 77
21.1 Statistical Evidence 77
22 Piekarek/Smirnov 79
22.1 The Third Pair 79
22.2 Statistical Evidence 80
23 Balicki/Zmudzinski 81
23.1 Statistical Evidence 86
24 American Contract Bridge League (ACBL) Data 87
24.1 Sectionals and Regionals 87
25 European Bridge League (EBL) Data 95
25.1 Open 96
25.2 Seniors 97
25.3 Women 98
26 World Bridge Federation (WBF) Data 99
26.1 Open 100
26.2 Seniors 101
26.3 Women 102
27 Computer Bridge 103
28 Top Players 105
28.1 Other Pairs 108
29 Opening Leads 109
30 Various Opening Lead Partnership Statistics 119
30.1 Opening Lead Function 1 (OLF1) 120
30.2 Opening Lead Function 1a (OLF1a) 121
30.3 Opening Lead Non-Competitive Function 1 (OLNCF1) 122
30.4 Opening Lead Non-Competitive Function 1a (OLNCF1a) 123
30.5 Opening Lead Function 2 (OLF2) 123
30.6 Opening Lead Function 2a (OLF2a) 124
30.7 Opening Lead Non-Competitive Function 2 (OLNCF2) 125
30.8 Opening Lead Non-Competitive Function 2a (OLNCF2a) 125
30.9 Opening Lead Function 3 (OLF3) 126
30.10 Opening Lead Function 4 (OLF4) 127
31 Other Opening Lead Statistics 131
32 Par 133
33 False Positives 139
34 Women 141
35 Seniors 143
36 Tournaments after September 2015 145
36.1 United States Bridge Championships (USBCs) 146
37 Best Defensive/Declarer Pairs – Played Cards 147
38 It Takes One to Know One 153
39 Access to Hand Records 157
40 Contracts 163
41 Best Card to Lead? 173
42 Bridge Data Formats 181
43 What Would You Lead? 185
44 It’s All About the Data 187
44.1 Under the Table – The Case Against the Blue Team 187
44.2 Spain v. USA, Wroclaw 2016 – Bathurst/Lall 188
44.3 Belladonna/Garozzo 1NT Answers 192
45 Impact of Cheating Players on Top Level Bridge 193
45.1 Costs of Going After Cheats 194
46 1955-1991 Bermuda Bowl Data 195
46.1 Summary 200
47 MD5 Protected Statements 201
48 Summary 203
Table of Figures
Figure 1. Bridge abbreviations xiii
Figure 2. Bridge pairs’ abbreviations xiii
Figure 3. Naughty Bridge pairs’ abbreviations xiii
Figure 4. Top seven pairs from top 66 using ACDF3 1
Figure 5. List of naughty players 4
Figure 6. Skills needed for detecting cheating in Bridge 9
Figure 7. EBTC 2014 final result and qualifiers for Bermuda Bowl 11
Figure 8. Fisher/Schwartz placement of board to indicate suit 15
Figure 9. EBL qualifiers to 2015 Bermuda Bowl 19
Figure 10. Expected number of heads from 10 fair coin tosses 24
Figure 11. Expected number of heads from 50 fair coin tosses 24
Figure 12. Expected number of heads from 100 fair coin tosses 25
Figure 13. Tournament MF values based on categories 47
Figure 14. MF values for top 13 tournaments from 1997-2014 48
Figure 15. WBF/EBL Events 1997-2018 MF values, 2,900 board minimum 49
Figure 16. Buratti/Lanzarotti board from Tenerife, 2005 59
Figure 17. Top 100 pairs percentage of opening leads to an ace or king 61
Figure 18. Top 100 pairs percentage of opening leads to an ace, king or queen 61
Figure 19. Elinescu/Wladow lead data from Bridgewinners 67
Figure 20. Elinescu/Wladow 1 in X values for finding lead 68
Figure 21. Binomial probability chart for orientation/high honor 72
Figure 22. Fantoni/Nunes leads from Monaco v. Iceland 72
Figure 23. Balls in urn without replacement Excel spreadsheet 74
Figure 24. EBL data on Balicki/Zmudzinski calls mentioned in Woolsey article 82
Figure 25. Balicki/Zmudzinski narrow bids, strong hands from EBTC 2014 83
Figure 26. Balicki/Zmudzinski wide bids, weak hands from EBTC 2014 84
Figure 27. MF values for ACBL MP ranges 2014-2018 87
Figure 28. MF values for MP ranges at NABCs 2013-2018 89
Figure 29. MF values for MP ranges at NABC+ events 2013-2018 89
Figure 30. Top 200 defensive MF values for NABC+ events 90
Figure 31. Top 300 pairs at ACBL Sectionals/Regionals defensive MF value 91
Figure 32. ACBL Sectionals and Regionals Pairs, 500+ boards. One player declares more than 65+% of boards 92
Figure 33. ACBL pairs, less than 1 in X chance playing ethically 93
Figure 34. ACBL partnerships with undisclosed partnership agreements 94
Figure 35. MF values for different types of EBL tournaments 95
Figure 36. Percentage of contracts made at EBL tournaments 96
Figure 37. Defensive MF value for top 100 pairs from EBL tournaments 96
Figure 38. ACDF2 applied to EBL tournament data 97
Figure 39. Top 50 EBL Seniors’ pairs defensive MF values 98
Figure 40. Top 43 EBL Women's pairs defensive MF values 98
Figure 41. MF values for different types of WBF tournaments 99
Figure 42. Percentage of contracts made for different types of WBF tournaments 99
Figure 43. Top 175 pairs from WBF tournaments 100
Figure 44. ACDF2 applied to WBF tournaments 100
Figure 45. Top 49 pairs defensive MF value - WBF Senior events 101
Figure 46. ACDF2 applied to WBF Senior tournaments 102
Figure 47. Top 50 WBF Women’s pairs defensive MF value 102
Figure 48 Top 87 pairs defense against top 120 pairs 106
Figure 49 Top 80 pairs on declarer play 107
Figure 50. Top 100 pairs safe opening leading percentage 111
Figure 51. Top 100 pairs safe opening leading percentages 112
Figure 52. Top 100 pairs opening lead - partner has an honor (AKQ) percentage 115
Figure 53. Fisher/Schwartz leads from EBTC 2014 that gave up a trick 115
Figure 54. Safe lead percentage for top 210 players - all contracts 116
Figure 55. Safe lead percentage for top 210 players - non-makeable contracts 117
Figure 56. Opening lead to AK (OLF1) top 100 pairs percentage 120
Figure 57. Opening lead to AK (OLF1) top 200 pairs percentage 121
Figure 58. Opening lead to AK (OLF1a) top 100 pairs percentage 122
Figure 59. Opening lead to AK (OLNCF1) top 100 pairs percentage 122
Figure 60. Opening lead to AK (OLNCF1a) top 100 pairs percentage 123
Figure 61. Opening lead to AKQ (OLF2) top 100 pairs percentage 123
Figure 62. Opening lead to AKQ (OLF2) top 200 pairs percentage 124
Figure 63. Opening lead to AKQ (OLF2a) top 100 pairs percentage 124
Figure 64. Opening lead to AKQ (OLNCF2) top 100 pairs percentage 125
Figure 65. Opening lead to AKQ (OLNCF2a) top 100 pairs percentage 125
Figure 66. Opening lead, non-competitive auction, P has A or K percentage 126
Figure 67. Opening lead, non-competitive auction, P has A, K or Q percentage 128
Figure 68. xx non-trump opening lead percentage in trump contract 131
Figure 69. Top 100 pairs trump lead percentage 132
Figure 70. Top 100 pairs average IMPs to par 133
Figure 71. Top 10 out of 50 Seniors pairs average IMPs to par 134
Figure 72. Top 10 out of 50 Women’s pairs average IMPs to par 134
Figure 73. Top 100 Open pairs declaring average IMPs to par 135
Figure 74. Top 10 out of 50 Seniors declaring average IMPs to par 135
Figure 75. Top 10 out of 20 Women’s pairs declaring average IMPs to par 136
Figure 76. Top 100 pairs defending IMPs to par 137
Figure 77. Top 10 out of 50 Seniors pairs defending average IMPs to par 137
Figure 78. Top 10 out of 20 Women’s pairs defending average IMPs to par 138
Figure 79. Pre and post summer 2015 tournament data 145
Figure 80. Top 26/181 defenders safe played card percentage excluding opening lead 147
Figure 81. Top 20/181 defenders safe played card percentage including opening lead 148
Figure 82. Top 15/50 defenders safe played card percentage excluding opening lead 148
Figure 83. Top 10/50 defenders safe played card percentage including opening lead 149
Figure 84. Top 10/50 pairs declarer safe played card percentage 149
Figure 85. Top 20/100 defenders ranked by percentage of safe played cards ignoring opening lead 150
Figure 86. Top 23/100 defenders ranked by percentage of safe played cards including opening lead 151
Figure 87. Top 10/100 declarers ranked by percentage of safe played cards from top tournaments 152
Figure 88. 48 bit keys and compute time for Charlotte Regional, October 2016 159
Figure 89. Mnemonics for card ranks 161
Figure 90. Likelihood of game, slam, grand slam 163
Figure 91. Likelihood of different hand shapes 163
Figure 92. Different hand generator results for ACBL 164
Figure 93. Contracts by suits in ACBL events 165
Figure 94. Contracts by suits in major IMP events 165
Figure 95. Contract frequency from different databases 167
Figure 96. Club contracts made percentage in ACBL tournaments 167
Figure 97. Diamond contracts made percentage in ACBL tournaments 168
Figure 98. Hearts contracts made percentage in ACBL tournaments 168
Figure 99. Spades contracts made percentage in ACBL tournaments 168
Figure 100. No trumps contracts made percentage in ACBL tournaments 169
Figure 101. All contracts made percentage in ACBL tournaments 169
Figure 102. Club contracts made in selected Vugraph tournaments 169
Figure 103. Diamond contracts made in selected Vugraph tournaments 170
Figure 104. Heart contracts made in selected Vugraph tournaments 170
Figure 105. Spade contracts made in selected Vugraph tournaments 170
Figure 106. No trump contracts made in selected Vugraph tournaments 171
Figure 107. All contracts made in selected Vugraph tournaments 171
Figure 108. Most popular, most successful and safest leads against IMP contracts 174
Figure 109. Most successful leads against makeable and non-makeable IMP contracts 176
Figure 110. Statistics on led card for suit contracts 179
Figure 111. Statistics on led card for no trumps contracts 180
Figure 112. Opening lead quiz 185
Figure 113. Answers to opening lead quiz 186
Figure 114. Belladonna/Garozzo 1NT range hands, 1973-1975 188
Figure 115. Third seat non-vulnerable calls by Kevin Bathurst/Justin Lall 190
Figure 116. Number of TVP/BBO boards in Bermuda Bowl 1955-2017 196
Figure 117. Number of boards for top 10 players 1955-1991 197
Figure 118. MF values for 1955-1983 Bermuda Bowls with different groups 198
Figure 119. Statements hashed by MD5 202
Preface
Someone cheated against me at a National Bridge tournament in Chicago 2015. There were no cameras, so there was nothing I could do. It was only one board, but it started me on a path to see if it was possible to detect cheating in Bridge using statistics. The answer is yes. It required significant research, new software, and countless hours of work. The result is software that is sensitive enough to detect the known cheaters of the past while excluding the world’s top honest players. In 2015, some of the world’s top pairs were caught cheating through extensive video analysis to determine their codes. The software quickly identifies the same pairs, without knowing how those pairs were cheating.The results indicate that there are top active players that have not been caught. The software can analyze suspicious pairs and identify pairs that are not cheating thus saving countless hours of watching videos.
The software can also identify many active players in the American Contract Bridge League (ACBL) who are in violation of the Laws of Bridge. A polite way of saying they are cheating.
More importantly, the statistics that can now be generated can be used to help improve the game of honest bridge players.
Chapter 1 - Introduction
It is possible to detect collusive cheating in Bridge using statistical methods. This had been an unsolved problem in Bridge for over 90 years. It was solved about four years ago in 2015. More importantly, it does not require humans with expert Bridge logic to analyze individual hands to determine if a pair is cheating. Computers with sophisticated software do the work.
To be more precise, it is possible to detect pairs that collusively cheat, without knowing their cheating methods, within statistically acceptable limits. Given sufficient data, these same methods can be used to detect historical cheating.
Using similar methods, it can be statistically determined how good a player and/or partnership is. Similarly, it is possible to use the same techniques to determine weaknesses in an individual player or partnership for training purposes.
Detecting cheating in Bridge has been a problem since Harold Vanderbilt introduced the current rules in 1925. Several pairs have been caught, but proving cheating has required knowledge of their cheating code or methods. Since 2015 several top pairs have been caught cheating by deducing some of their code through videos. Future cheaters will use varying codes (different meaning on different board numbers) making it highly unlikely that any future cheaters will be caught using videos. Statistics becomes the only method to detect cheating. This book shows the many different statistical methods that can be used, and also how these methods are able to detect the known cheating pairs from the past, without knowing how they were cheating.
Chapter 2. My History
I played Bridge briefly as a teenager growing up in Nottingham, England. I re-started playing in 2002 in Atlanta. I was very surprised that, unlike nearly all major sports, there are no statistics or meaningful rankings that are applied to Bridge. I wanted to improve my game so I created an Excel spreadsheet to track various statistics. I have this personal data back to 2004. This data has helped me validate some of the work in this book. The statistics were quite detailed and would usually take me 15-30 minutes after a pair session, or 5-10 minutes after a team game, to create. I was able to track my progress and the ability of my partners with this data. I found it very useful. For example, if I was at a tournament and my declarer rating went down, I would read a chapter on declarer play.
At the summer American Contract Bridge League (ACBL) North American Bridge Championship (NABC) in Chicago in 2015, someone cheated against me. It was in a limited masterpoints national event at the end of the tournament. Declarer played a card from dummy, finessed through my queen with their jack, and then played to the next trick without checking if my partner had won the trick with the queen. The whole time they were glaring at me with a huge smile on their face enjoying their moment of trickery. Declarer did not even glance at my partner.
It was pointless to report. Recorder forms had little effect at the time. Before anyone claims that this could have happened for a number of reasons, it was early in the board so no counting of points could be done. We had not bid. I had kept my cards underneath the table. My partner kept their cards close to themself. Neither declarer nor dummy had peeked at our hands.
The card backs are colored. I thought back to who had dealt the different boards and realized that declarer had shuffled and dealt that board. It is simple for even an amateur magician to track one card in a deal and know who is dealt that card. The smile and gleam in declarer's eye gave the game away - in fact, I think they wanted me to know that they had pulled one over on me and there was nothing I could do about it. I recall smiling back at them at how effective it was. They had made their point.
At my next tournament, I took a deck of cards and had someone film me shuffling and dealing the cards to show how easy it is to cheat in an ACBL team event. I also wrote up how easy it is to fix this type of cheating, see https://www.bridgewinners.com/article/view/cheating-in-acbl-tournaments. A small change in the procedures and this problem goes away. There has been no change in how ACBL National Swiss events, both open and limited masterpoints, are handled. It is still trivial to cheat in the same way. I am sure that the same player continues to play this way at ACBL Swiss events including National events.
The problem is shown at https://www.youtube.com/watch?v=QQvwZ1ncDZY. This reference means type https://www.youtube.com/watch?v=QQvwZ1ncDZY into a browser. The video is one minute long and shows a typical shuffle/deal at an ACBL Swiss event except the location of a card (queen of clubs) is shown at the end. To see how this is done, see YouTube(1DLqoGbrDGM) . This video is also a minute long. To solve this problem, the easiest solution is to shuffle, then pass the cards to an opponent for them to cut and deal. This change in procedure should be required in all ACBL Swiss events. It has been suggested to ACBL. They rejected the idea.
Update: I played in the 0-10K Swiss at the Memphis NABC in March 2019. It is still a player shuffle-and-deal event, no passes, no cuts. My partner was aware that I am involved in detecting cheating. When we went to start a new match, I saw who we were playing and told my partner, before we arrived at the table, what was going to happen. Sure enough, I predicted what happened. There were no cameras in the room. No point in filing any recorder forms.
Later in the same event, we were sitting at another table and starting to shuffle/deal the cards for our next match. My partner was now attuned to how players cheat and she nodded her head to the table next to us. South was about to start dealing his second board. My partner had seen him deal his first board. He picked up the cards, shuffled, and looked at the bottom card. He was trying to distract his opponents when he was “shuffling” and looking at the bottom card, but his clumsy shuffle technique meant that North could see the bottom card, and so could both of us as we were behind North. It was the eight of clubs. He shuffled again, turned the deck over to look at the bottom card, it was the seven of clubs. He shuffled again, looked again, the bottom card was now the ace of spades. He then shuffled six more times but did not look at the bottom of the deck. After each shuffle the ace of spades remained on the bottom of the deck. We could easily see the bottom card because of how he was shuffling and so could North. He then dealt the board. The current ACBL President was at the next table diagonally opposite from us. No cameras in the room, no point in filing a recorder form, but another name added to my list of players that I will require a cut before they deal (Bridge Law 6 allows me to request this in Swiss events).
In my teenage years, I appeared on "The Paul Daniels Magic Show". This was a British Saturday night television show that was watched by over 15 million people. Every segment was rehearsed multiple times, including my segment, without the audience present. I was taught where to stand, and more importantly where not to stand, to make sure I did not leave the camera view and to make sure I did not block the audience or camera view of the trick. I also had the chance to watch the other tricks that night. After watching enough rehearsals, it became clear how each trick was done, including the trick that Paul did with me. My parents were in the audience during all the rehearsals. They watched the same rehearsals as me, but were unable to see how any of the tricks were done. I had the advantage of being on stage to see up close.
Both Paul and Ali Bongo (real name William Wallace, he was the magic consultant for the show, not the Ali Bongo who became President of Gabon in 2009) would occasionally stop a rehearsal to improve the trick, or to make it less likely that the real magic could be discovered. It was always important that the camera was on the action to prevent the television audience from thinking that something was happening outside of the screen.
Paul was an impressive magician. Most impressive was his sleight of hand and redirection where your eyes are focused on where you think the trick is, but in fact something else is going on elsewhere, that is the magic.
I do not claim to be more aware than others in playing Bridge. However, having been exposed to both Paul and Ali Bongo, I am probably a little more aware than others when it comes to spotting misdirection.
On the way home from the Chicago tournament in 2015, I wondered if it would be possible to detect cheating players using mathematics and statistics. I had an epiphany on the train to the airport and later explored the idea.
No one, as far as I knew, had attempted to solve the problem of detecting cheating in Bridge using a mathematic model. It was too complex a problem. However, I had some tools and background that others did not have.
My company had developed ACBLscore+, since renamed Bridgescore+. ACBL had paid $1,500,000 to develop this software and my company had rights to it. Towards the end of the contract, ACBL found out that they did not own the Copyright to the code and their outside legal counsel told them that without the Copyright they should not use the code. Rather embarrassing for ACBL. My company both owned the Copyright, and more importantly, full rights to continue developing the code.
Bridgescore+ has the ability of importing files from various data sources including ACBL, Bridge Base Online (BBO), European Bridge League (EBL) and World Bridge Federation (WBF).
In my youth, I was very adept at solving the Rubik’s Cube. For a while, I was the fastest in the world, I appeared on many television shows and was mentioned in several publications including Scientific American. I developed one of the earliest software programs to solve the Rubik’s cube and also did some work on the mathematics of the cube. In other words, I was (am still?) quite good at solving problems and quickly spotting patterns.
I won an academic scholarship to study Mathematics at Gonville & Caius College, Cambridge. Professor Stephen Hawking gave one of the earliest lectures to the ten of us studying mathematics at Caius that year. I changed to Computer Science after one year of mathematics, and my professional career has been in the computer industry.
I set up the security of the world’s first on-line bank, Security First Network Bank, and made the first ever Internet banking transaction. In 1995, I started a company that performed computer security audits and had audited about 150 of the first 500 on-line banks, credit unions and stock markets before I sold the company. All of my work was white-gloved. We created the industry of security audits. Our methodology and technology was used by other vendors.
It is important to know how to think like a bank robber if you want to break in to a bank. In a similar vein, it is important to be able to think like a cheat if you want to detect cheating in Bridge. I was also one of two people that had the “keys to the [Internet] kingdom”. I had developed the secure web site that protected software keys that allowed anyone to break in to various sites across the Internet. This became one of the most attacked sites on the Internet and, to the best of my knowledge, was never broken in to. The front end of the software handled $100M+ of business. The back end was connected to warehouses in multiple continents and accounting systems in multiple countries. Therefore, I had early exposure to some of the most sophisticated attacks on the Internet and always had to make sure the site was safe, as well as handling a moderately complex data set. Computer security and cheating in Bridge are similar – you always want to be one step ahead. Sadly, detecting cheating in Bridge has been years behind, never ahead, until now.
I have had moderate success in Bridge. I have won limited masterpoints ACBL national events in both pairs and teams. I have played in the finals of an American Bridge Association (ABA) national knockout event. I won the consolation World Mixed Pairs event in Wroclaw, 2016 and qualified for the finals of the World Mixed Pairs in Orlando 2018. I am not in the world’s elite, but I can occasionally take my tricks.
My background includes the necessary tools to attack the problem of detecting cheating in Bridge. I have mathematical and computer skills, a reasonable Bridge background, experience of handling "Big data", experience in working in a new unknown field, Bridge software and a personal motive for wanting to tackle the cheating problem in Bridge.
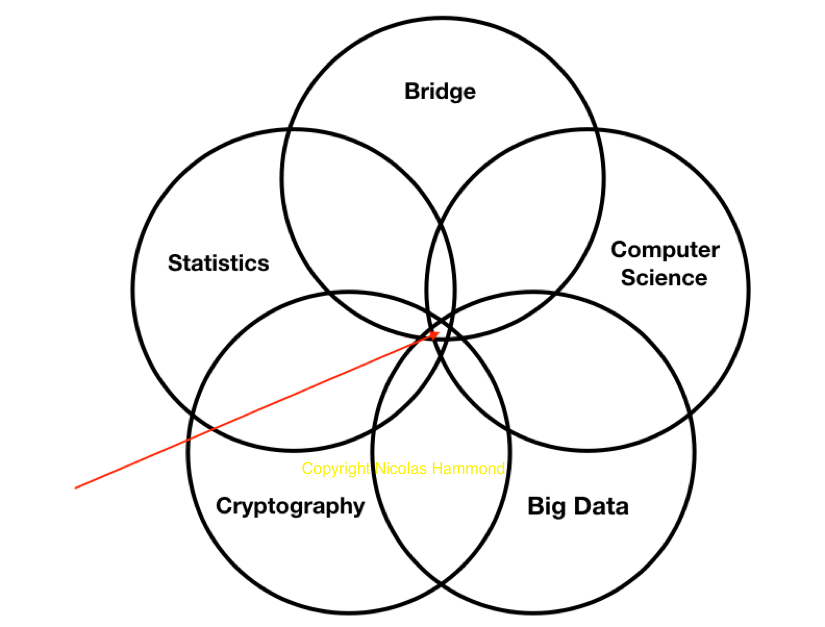
Figure 6: Skills needed for detecting cheating in Bridge I have provided more background on myself than I intended, but I think it is important that you understand the credentials of who is writing this book and why.
In August 2015, I started to develop tools to validate the ideas that occurred to me on that train in Chicago. There were five generations of cheating detection that I could see being developed:
- Detect cheating at a tournament
- Detect cheating by pairs
- Detect where pairs are likely to be cheating
The remaining two generations have been partially developed but are not listed for proprietary reasons. Within each generation of software there are multiple software modules that can be written.
On August 19, 2015, I made the first mention of using statistics to detect cheating, see https://www.bridgewinners.com/view/article/technical-solutions-to-stop-cheating. By then I already had some rudimentary tools in place.
Little did I know what was about to happen in the world of top level Bridge ...
Chapter 8. Bridge is a Game of Mistakes
Bridge is a game of mistakes. All players make mistakes. Very importantly, cheating players also make mistakes - lots of them. The difference between a cheating pair and a world class pair is that the cheating pair makes fewer mistakes in certain areas of the game because the cheating player has additional information. Those mistakes are, within reason, quantifiable and measurable.
... more in book ...
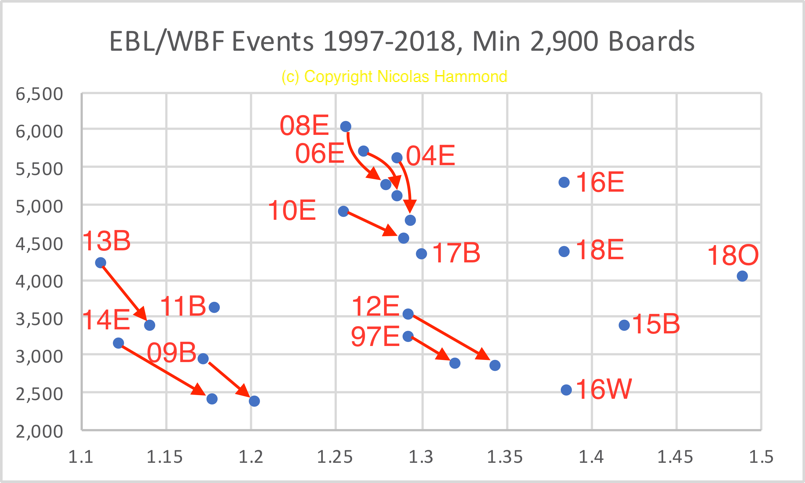
The data is from EBL/WBF events from 1997-2018 with a minimum of 2,900 boards on Vugraph. The code is a two digit year with B=Bermuda Bowl, E=European Bridge Team Championship, O=WBF Open Teams, W=EBL Winter Games. The Y axis is the number of boards from Vugraph for selected tournaments. The X axis is the MF value. The arrows shows what happens when data from the known cheating pairs is removed. In all cases, the value increases, as expected.
For the Bermuda Bowl, we see that 2009, 2011 and 2013 are all to the left of the chart. We assume that no one was willing to risk cheating in the 2015 Bermuda Bowl because of the cheating revelations in the summer of 2015. The 2015 MF value is way off to the right of the chart. This is what happens when all players are on notice that cheaters may be caught. This is the value from an honest Bridge tournament. For the 2017 Bermuda Bowl, the value has moved back to the center.
The 18O value is from the 2018 WBF Open Teams event in Orlando.
For the European events, we see that 2006-2014 are all to the middle or left of the chart. The MF value starts out below 1.30. The 2014 EBTC shows the most cheating. The 2016 EBTC and 2018 EBTC are significantly to the right. The EBL events are all over 1.38 since 2015.
Look at the tournaments on the right side of the chart, to the right of the 1.3 line. These are the recent tournaments, 2015-2018. Look at the tournaments on the left side of the screen, to the left of the 1.3 line. These are the pre-2015 tournaments. This dramatic change in the MF value cannot be explained by removing only the known cheating pairs. There was a dramatic change in the amount of cheating in top level Bridge after 2015. This last chart is the most damning evidence of this fact. The MF value was designed to detect cheating.
The chart illustrates the impact of cheating at the top levels of Bridge over the last twenty years. The chart shows the effect of removing the known cheating pairs. The MF value moves to the right when cheating pairs are removed. The chart shows the impact on the undetected cheating players when there is suspicion that they may be caught. The values for 2015-2018 are significantly to the right of previous years. Even when we remove the known cheating pairs from earlier data, the values for 2015-2018 are still significantly to the right. This indicates that there are many cheating pairs from earlier years that have not yet been caught. Examining the data shows who they are.
Chapter 28. Top Players
I took the data from top tournaments, which includes the major ACBL, EBL and WBF championships, and generated statistics. This is Vugraph data; therefore, there is additional information available on each board. I then sorted the pairs based on the amount of data I had on each pair and took the top 120 pairs. A strange number but there were some pairs in the 100-120 range that I wanted to include in the data. 24 of the 120 pairs are from USA/Canada.
[...]
I redid the results from the same tournaments, but only included data when one of these top pairs played against another. I generated statistics on this data. I repeated this step but excluded all players from the naughty list.
I now have three sets of data: top tournaments, top tournaments with only the top 120 players playing against each other, top tournaments with the top 120 players but excluding players from the naughty list.
For the following diagram, I removed the bottom 15 pairs. There is not sufficient data for these 15 pairs to have meaningful results when they played against the other pairs. However, I added back in Hamman/Wolff and Belladonna/Garozzo. I am sure everyone is curious where these superstars from the past appear in the chart. For presentation purposes, I then removed an additional 20 pairs. These 20 pairs are spectacularly bad at defense compared to their peers. Their data-points all appear to the right of the chart under the 600 line.
[...]
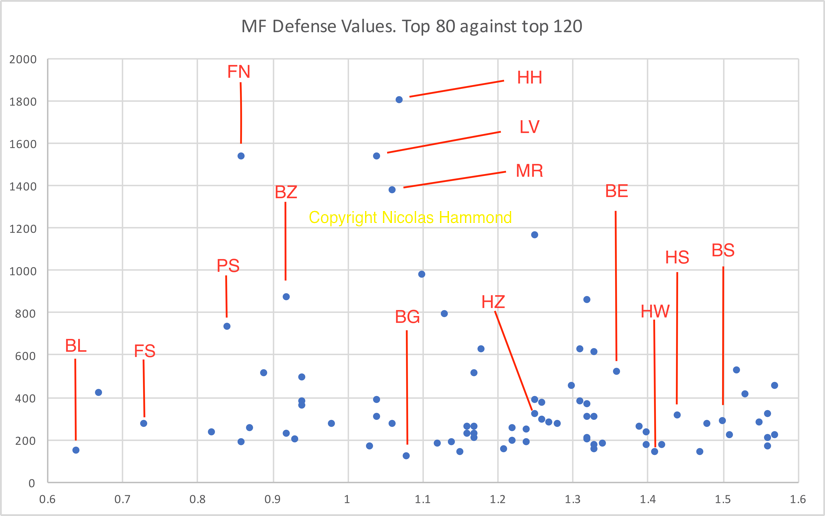
This chart shows how the top pairs play against other top pairs on defense. It only includes data from top tournaments. Lower values on the X (horizontal) axis show better defenders. The value on the Y (vertical) axis is the amount of data for each pair. The higher the number, the more the data. The Law of Large Numbers (LLN) implies that as more data is added, the better the quality of the result in the X axis.
The first five annotated pairs from the left are Buratti/Lanzarotti (BL), Fisher/Schwartz (FS), Piekarek/Smirnov (PS), Fantoni/Nunes (FN) and Balicki/Zmudzinski (BZ). All of these pairs are on the naughty list. All of these pairs are outliers to the left of the chart – the further left, the more likely they are to be cheating. This chart is highly indicative of cheating pairs. The pairs with the most data that have very similar MF values are Helgemo/Helness (HH), Lauria/Versace (LV), Meckstroth/Rodwell (MR). The difference in MF values between the three pairs is very small.
Bob Hamman is shown with three partners: Soloway (HS), Wolff (HW) and Zia (HZ). Boye Brogeland is shown with two partners: Espen Lindqvist (BE) and Erik Saelensminde (BS). Belladonna/Garozzo is shown as BG. We see from this chart that Belladonna/Garozzo were not quite as good on defense, using this statistic, as the modern-day superstars Helgemo/Helness, Meckstroth/Rodwell and Lauria/Versace. Balicki/Zmudzinski (BZ) are known to cheat on defense and signal their distribution and high cards in suits. Despite this, we see that some pairs are able to defend better than Balicki/Zmudzinski.
[...]
It is interesting to compare the data for top pairs before 2015 and after 2015. For a proper comparison, I only compared the data when top players played against each other. For somewhat obvious reasons, I am not publishing the data. There are some pairs that suffered a “dip” in playing ability after the summer of 2015, then recovered after time to become statistically close to their previous playing ability. Amazing how that happened.
... more in book ...
Chapter 29. Opening Lead
The opening lead is one of the most critical decisions in Bridge. Almost 20% of the opening leads at top team events give up a trick. The elite World Class pairs, Meckstroth/Rodwell, Lauria/Versace and Helgemo/Helness, give up a trick 17-19% of the time. Thousands of books have been written about bidding, but very few about opening leads. Improving your opening leads by even a small amount will see the biggest improvement in your game. This chapter contains the best tip for improving your opening leads.
Data created by players for the opening lead cannot be trusted. I did analysis of the opening lead from the Pairs events at the 2016 World Bridge Federation (WBF) tournament in Wroclaw, Poland and the 2018 WBF events in Orlando, USA. Far too many players do not accurately record the opening lead. In Wroclaw, it was about 1 in 8 boards where the alleged opening lead was not in the opening leader’s hand. As such, little meaningful statistics and no cheating detection can be done on data provided by players.
[...]
I took the data from all tournaments, including Women and Seniors, in my database. There are over 5,000 pairs. I took the 100 pairs with the most data. I then ran double dummy analysis on the opening lead to see if it gave up a trick or not.
The vertical axis in the next chart shows the number of boards for each partnership. The horizontal axis is the percentage of opening leads that were safe (did not give up a trick per double dummy analysis). The further to the right, the better the percentage of safe opening leads. The higher in the chart, the more data on the partnership. Some players appear more than once because they have played with multiple partners, Bob Hamman appears three times with different partners – Soloway, Wolff and Zia. Fisher/Schwartz are known to cheat on opening leads. Can you spot them in the next chart (hint: I have between 500-1,000 records on them)?
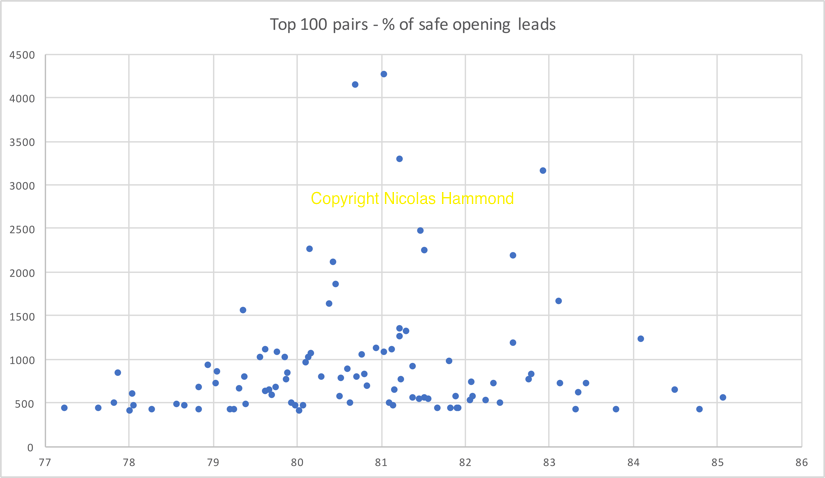
So, where were Fisher/Schwartz? This is the same data but annotated with the pairs on the naughty list:
... more in book ...
If you are going to play against Jeff/Eric, Lorenzo/Alfredo, Steve/Bobby, Geir/Tor, Chip/Lew, Andrey/Alexander, Franck/Pierre, Nick/Ralph, Espen/Boye, Boye/Erik, Zia/Michael, Fred/Kit, Bob/Zia, Sylvie/Benedicte, Geoff/Eric, Roy/Sabine, Bob/Bobby, Sally/Nicola, Marion/Meike, David/Alan, Tony/Andrew or David/David, where should you sit?
Obviously, you want to be able to tell the best stories in the bar afterwards, so you want the weaker opening leader on your left so they are on lead when you declare – more chance of a better story to regale others for years to come. So, who is the stronger opening leader in these well-known partnerships?
... answer in the book ...
Chapter 36. Tournaments after September 2015
Did the outing of cheaters in the summer of 2015 change Bridge?
I took the Vugraph data from top tournaments and compared the data from before September 2015 (pre-2015) against the data after September 2015 (post-2015). These are the same tournaments and we would therefore expect similar statistical results. However, we know that at least four pairs from pre-2015 are not playing post-2015. What you do not know is the number of additional pairs that may have been cheating pre-2015 and how the knowledge that video-detection of cheating codes has changed their behavior.
[... Data removed from snippet ...]
The “Pre-2015 (-n)” shows the data from the same tournaments but without any data from any player on the naughty list. The amount of data has dropped by over 10%. The MF value has increased. The MF formula was designed to help detect cheating, and we see an increase in its value, which is what is expected when cheating pairs are removed from the data. The percentage of makeable contracts decreased by about 0.2%. This means that players were either bidding worse or were less likely to compete/sacrifice. If you were cheating on the bidding, then you are more likely to sacrifice. The overall percentage of contracts made remained the same. The percentage of makeable contracts that was made remained the same. This implies that the level of declarer play remained the same. If you are in a makeable contract, the onus is more on the declarer, than the defense, to make an error.
We would expect, assuming that all the cheating pairs have been identified, that the MF values for “Pre-2015 (-n)” and “Post-2015” would be similar. These are the same tournaments and mostly the same players. But they are not the same. The MF value has increased dramatically. It should have remained the same. Why? The MF formula detects cheating. If you were a cheating pair prior to 2015, and you know that you are now more likely to get caught, you are likely to stop cheating. Or find a different partner.
The difference in MF values between the “Pre-2015 (-n)” and “Post-2015” can only be explained by:
I cannot emphasize enough the importance of the change in MF value from “Pre-2015 (-n)” to “Post-2015”. The known cheating pairs are not playing. The unknown cheating players are still playing, but just not cheating as much. The change cannot be explained by only a few pairs.
I took the top 150 pairs based on amount of data from all tournaments from pre-2015. I sorted based on double dummy error percentage on defense. For post-2015, I took the amount of data I had for pair #150 from pre-2015 and made that the minimum amount of data for pairs from post-2015 tournaments. I ended up with 64 pairs. I sorted these 64 pairs based on double dummy error percentage on defense. I should have equivalent data sets. Pre-2015, there are ten pairs that have a double dummy error rate less than my cheating threshold. Five of these pairs are known naughty pairs. What about the other five? Simply brilliant Bridge players – what else would you think? Post-2015, there are none. Bridge became a lot harder after 2015. Must be climate change.
[...]
Chapter 45.1 - Costs of Going After Cheats
The World Bridge Federation (WBF) normally does not make its accounts public, but a copy was made available in 2015. The WBF had approximately two million Euro in reserves and an annual revenue of approximately the same in Bermuda Bowl years. For comparison, the world’s top playing sponsors have a similar annual bridge budget.The German Doktors cheating case should have been a relatively simple case but some internal legal errors made early came back to haunt the WBF. The German Doktors cost the WBF over 100,000 Euros. The vast majority went to outside legal counsel.
The European Bridge League (EBL) spent over 300,000 Euros on the Fantoni/Nunes case. Again, the vast majority on outside legal counsel.
The EBL spent over 10,000 Euros on the Balicki/Zmudzinski case.
In all three instances, the WBF and EBL lost their cases.
The cost of a bridge organization pursuing a cheating pair is very high.
Chapter 46 - 1955-1991 Bermuda Bowl Data
The first and most important point to make is that there is probably not enough data to make statistical claims on most individual pairs beyond a reasonable doubt. If anyone is willing to take the information from the various Championship books and add it to The Vugraph Project (TVP), then this will increase the amount of data on individual pairs and make it easier to make more definitive statements.The stories I have heard from this era are:
- All the Italians cheated.
- Reese/Schapiro cheated.
- The Italians and Reese/Schapiro were the only ones that were cheating.
- The declarers were as good as the declarers today.
- Defenders today are better because there are more methods and better agreements.
With the understanding that the data is limited and that definitive statements cannot be made; I will attempt to answer all of those stories from a statistics perspective.
Everyone has their opinion about what was happening during this period, along with their own national prejudices and bias. I was born in England and moved to the USA over thirty years ago after graduating from college. Therefore, my potential prejudices are stated. However, I will attempt to report on the statistical data from an unbiased perspective.
All the data from this period is from The Vugraph Project (TVP). The tournaments are:
| Tournament | Number of boards | MF value |
|---|---|---|
| 1955 Bermuda Bowl | 440 | 0.9519 |
| 1957 Bermuda Bowl | 445 | 1.1724 |
| 1959 Bermuda Bowl | 310 | 1.0294 |
| 1962 Bermuda Bowl | 415 | 1.1684 |
| 1967 Bermuda Bowl | 256 | 0.9800 |
| 1973 Bermuda Bowl | 255 | 1.0208 |
| 1974 Bermuda Bowl | 191 | 0.9111 |
| 1975 Bermuda Bowl | 192 | 1.2500 |
| 1977 Bermuda Bowl | 191 | 1.1714 |
| 1979 Bermuda Bowl | 188 | 1.0222 |
| 1981 Bermuda Bowl | 186 | 1.2500 |
| 1983 Bermuda Bowl | 351 | 1.5185 |
| 1955 through 1983 | 3,420 | 1.1087 |
| 1987 Bermuda Bowl | 278 | 0.9153 |
| 1955 through 1987 | 3,698 | 1.0937 |
| 1991 Bermuda Bowl | 135 | 0.8056 |
| 1955 through 1991 | 3,833 | 1.0806 |
| 1995 Bermuda Bowl | 319 | 2.0000 |
| 1997 Bermuda Bowl | 1,202 | 1.1933 |
| 2000 Bermuda Bowl | 700 | 1.3281 |
| 2001 Bermuda Bowl | 255 | 1.6136 |
| 2005 Bermuda Bowl | 1,869 | 1.3958 |
| 2007 Bermuda Bowl | 2,698 | 1.2012 |
| 2009 Bermuda Bowl | 2,930 | 1.1738 |
| 2011 Bermuda Bowl | 3,587 | 1.1798 |
| 2013 Bermuda Bowl | 4,182 | 1.1127 |
| 2015 Bermuda Bowl | 3,350 | 1.4212 |
| 2017 Bermuda Bowl | 4,304 | 1.3022 |
| 1991 through 2017 | 25,531 | 1.2463 |
| 1991 through 2017 – no cheaters | 23,588 | 1.2651 |
Figure 116. Number of TVP/BBO boards in Bermuda Bowl 1955-2017
The 1981 data is the final between Pakistan and USA. The 1983 data is the final between Italy and USA. The 1987 data is the final between Great Britain and USA.
The number of boards for each tournament is not enough for the MF value to be statistically meaningful. I normally look for at least 2,000 records from a single tournament. However, the combined data for all tournaments is significant enough. The combined tournament MF value for 1955-1991 is ridiculously low at 1.0806 with over 3,800 boards. This means that either the players were spectacularly bad at declaring, or phenomenally good on defense, or there was cheating, or this is a statistical anomaly. The Law of Large Numbers (LLN) can help give an estimate on the likelihood of this being a statistical anomaly. The players in the finals are regarded as the world’s best. However, the players will be tired from playing Bridge all tournament. But this same statement can be made for data from all Bridge tournaments. No other modern tournament comes close to a MF value this low, therefore it is reasonable to assume that players were cheating. It is impossible to identify which pairs were cheating, beyond some reasonable doubt, as there are too few boards for each pair with some exceptions. It is possible to identify which pairs were most likely not cheating.
I sorted the data based on the number of boards for each pair from 1955-1991.
| Pair | Country | # Boards |
|---|---|---|
| Bob Hamman/Bobby Wolff | USA | 534 |
| Benito Garozzo/Giorgio Belladonna | Italy | 462 |
| Giorgio Belladonna/Walter Avarelli | Italy | 436 |
| Guglielmo Siniscalco/Pietro Forquet | Italy | 299 |
| Benito Bianchi/Pietro Forquet | Italy | 192 |
| Boris Schapiro/Terence Reese | England | 190 |
| Benito Garozzo/Pietro Forquet | Italy | 190 |
| Eugenio Chiaradia/Massimo D'Alelio | Italy | 187 |
| Charles Coon/Eric Murray | Canada | 182 |
| Dana De Falco/Arturo Franco | Italy | 174 |
Figure 117. Number of boards for top 10 players 1955-1991
Six of these pairs have a defensive MF value under 0.85. That is low. This is in the cheating range. One of these pairs has a defensive MF value of 1.32, another is 1.92. Both of these pairs are Italians. A high defensive MF value indicates that the pair is not cheating. I have not listed the actual MF values because the number of boards, apart from perhaps the top three pairs, is too low to be statistically relevant beyond a reasonable doubt. Given the high defensive MF values for two of the Italian pairs on this list, I can state that if they were cheating, they were spectacularly bad at it. Therefore, I will conclude that the statement that all Italians were cheating is false.
The data for tournaments through 1983 has 3,420 boards and an MF value of 1.1087. Suppose I remove all boards with Italians. I now have 1,024 boards and an MF value of 1.1185. The number of boards is below my usual threshold for significance. The MF value without any Italians is still too low compared to expected norms. Removing all of the Italian players barely moved the MF value. The conclusion is that the quality of play/amount of cheating is the same with or without the Italians. If you believe that all the Italians cheated, then the data is saying that their opponents were also cheating. Granted, the number of boards is low. If we remove the Italians and the British, then the MF value at 1.2625 is much closer to norms for world class Bridge, however, there are very few boards. There is data on some American pairs, though small, that indicates that they may also have been cheating. If I remove some selected American pairs, the number of boards drops to 2,775 but the MF value increases quickly to 1.2102. If I then remove the data on Reese/Schapiro the number of boards drops to 2,674 and the MF value is at 1.2460. This is close to the norm, but still a little low. This result was achieved without removing any Italian pairs from the data.
| Tournaments 1955-1983 | # of boards | MF |
|---|---|---|
| All players | 3,420 | 1.1087 |
| - No Italians | 1,024 | 1.1185 |
| - No British | 2,854 | 1.1268 |
| - No Reese/Schapiro | 3,203 | 1.1351 |
| - No Italians, no Reese/Schapiro | 807 | 1.2308 |
| - No Italians/no British | 458 | 1.2625 |
| - Without some Americans | 2,775 | 1.2102 |
| - No Reese/Schapiro, without some Americans | 2,674 | 1.2460 |
Figure 118. MF values for 1955-1983 Bermuda Bowls with different groups
The data strongly indicates that there were cheating pairs in the 1955-1983 time frame. The number of boards for each pair is, unfortunately, too small to state beyond a reasonable doubt which pairs were cheating. It is false to state, based on the statistics, that all Italians were cheating.
I only have 190 boards on Reese/Schapiro. All of this data is from the 1955 Bermuda Bowl. The number of boards is too low to draw conclusions beyond a reasonable doubt, but some speculation can be done. Their declarer MF value is 0.83. Their defensive MF value is 0.57. Their declarer MF value is very low. If I take the data of the top 100 pairs from all tournaments, there are only three pairs with a declarer MF value below 1.0, all are above 0.92. We can therefore conclude that their declarer play at the tournament was beyond poor compared to their peer group. There are other measures of declarer play. Reese/Schapiro also do poorly on those measures. In the peer group of the top ten pairs with the most declarer data from 1955-1983, Reese/Schapiro are last by some way. However, their defensive MF value is the best of the top ten, by far. Put simply, you cannot be that bad at declarer play and that good on defense. With this little data, it cannot be stated that Reese/Schapiro were cheating beyond a reasonable doubt; however, if I were in charge back then, and if I had the data I have now, I would put at least two monitors at their table. Something is clearly not right.
To try and put this data in another perspective. If I look at the data from all players from all tournaments, and select the number of pairs that have at least the same amount of data as Reese/Schapiro, including all cheating pairs, and sort by lowest defensive MF value, then Reese/Schapiro are third out of 481 pairs. No pair towards the top of this list have as bad a declarer MF value as Reese/Schapiro.
Reese/Schapiro have received the most notoriety because of the cheating accusation at the 1965 Bermuda Bowl in Buenos Aires. I have no data from the 1965 Bermuda Bowl therefore cannot make any comments on what happened at that tournament. If anyone can provide this data, I will be happy to run the numbers and publish them.
Reese/Schapiro have a ridiculously low defensive MF value, but there are at least two British pairs from the 1955-1983 era who had even lower values. Admittedly there are fewer boards on those pairs and the possibility that this is from expected statistical deviations increases. One pair has an even lower declarer MF value than Reese/Schapiro making them even more suspicious.
Balicki/Zmudzinski have a defensive MF value of 0.85. We know that they were signaling during defense. If we use this value as a threshold and choose a very low number of 30 boards on defense, then there are 12 pairs from this era that match the criteria. It is almost certain that because of the low number of boards and the LLN, that there are some players in this group that could be in this category through normal statistical deviations. Of those 12 pairs, there is one Italian pair in the top seven and six Italian pairs in total, filling slots 8-12. There are four American pairs.
ADCF3 requires fewer boards to generate statistically relevant results. If I take the data from the top 100 pairs from all tournaments, and select the ADCF3 value for the lowest ranked known cheating pair as a reference, then there are five pairs in the 1955-1983 era that have a higher value. The implication is that all these pairs were cheating. Three are Italians. I confess that when I first wrote the section on Reese/Schapiro, I assumed it was data from the infamous 1965 Bermuda Bowl. Bridgescore+ generates summary data on each partnership. It was only when I was looking at some of the records in more detail that I realized the data was from 1955. I do not know of anyone that has looked at the data from the 1955 Bermuda Bowl and analyzed this tournament for cheating to this depth.
The data from the 1958 Bermuda Bowl final was made available just before this book was printed. There were 326 boards. The MF value was 0.94. The data is not included in the any of the results above.
46.1 Summary
The data on each individual tournament from 1955-1983 is too small to be statistically analyzed beyond a reasonable doubt. The data on individual players from 1955-1983 is, for most partnerships, too small to be analyzed beyond a reasonable doubt. The totality of data from 1955-1983 is sufficient to be analyzed.The comparison of the statistical analysis from 1955-1983 with more modern data, shows suspicious activity during this time period; and by much more than one pair. The obvious explanation is that multiple pairs were cheating.
Based on the data, it is reasonable to assume that some Italian pairs were cheating. There is insufficient data to state which pairs but there is enough data to imply certain pairs. There is data on some Italian pairs to indicate that those pairs were not cheating.
It is reasonable to assume that Reese/Schapiro were cheating, along with at least one other British pair, possibly more.
It is also reasonable to assume that some American pairs were cheating, but there is insufficient data to state that any specific pair was cheating, only data to indicate that some pairs within a certain group were cheating.
Through 1983, Bob Hamman and Bobby Wolff had a declarer MF value of 1.04 and a defensive MF value of 1.24. Both values indicate no cheating. The same is true with their lifetime declarer and defensive MF values.